
Twists, Inversions, Shape Shifters—Three Theories
What twists, inverts, and shifts its shape with time? What’s a yield curve?
The time or term structure of interest rates, often referred to as “yield curves,” moves continuously as bond prices respond to changes in interest rates. The yield curve graphs this relationship between bond yields (change in price reflected in yield) and bond maturity (time or term).
The bonds graphed in a yield curve are identical in every way except maturity. For example, the Treasury yield curve compares the three-month, two-year, five-year and 30-year Treasury yields. It is the one most commonly used by investors. Though we could also graph the term structure of corporate bonds that have the same credit quality, the Treasury bond yield curve is preferred because the bonds are risk free and, owing to their popularity and deep market, they are very liquid too. Treasury prices and yields, then, reflect the time value of money more directly since we can set aside the credit risk or liquidity premiums that are present in most other debt. While US government debt may not be entirely risk free, we assume that the US government would be extremely reluctant to default on its government obligations.
Why should I care about yield curves?
I remember when I was preparing for the Level II CFA® exam, tackling fixed-income valuation and trying to make sense of the term structure of interest rates. Understanding that the curve was not static, but a dynamic representation of both today’s rates of interest and a forecast of expectations about where rates may be heading in the future helped me to learn how interest rate movements impacted both fixed-income and equity valuations. In fact, learning about yield curves is especially timely! What if I told you that today’s yield curve is flattening and many fear the curve may invert? Would this mean anything to you? What if I told you that in the US, an inverted yield curve has preceded every recession since 1960? Would that be meaningful? Yield curves tells us about consensus expectations of future interest rate changes and economic activity—whether the economy will continue to grow or sink into a recession.
What recognizable forms do these shape shifters take?
I have always found that telling myself stories from the data I was struggling to master helped me remember the material and aided in the depth and clarity of my newly acquired knowledge. What do I mean by stories, you may ask? I try to see what information is right there in the data and the story it conveys. For example, a yield curve may take many forms and each one tells us a story. Let’s look at these next.
There are three basic forms or shapes of yield curves: upward-sloping (normal), flat, and downward-sloping (inverted or humped).
Figure 1: Upward-sloping maturity

Figure 2: Flat maturity
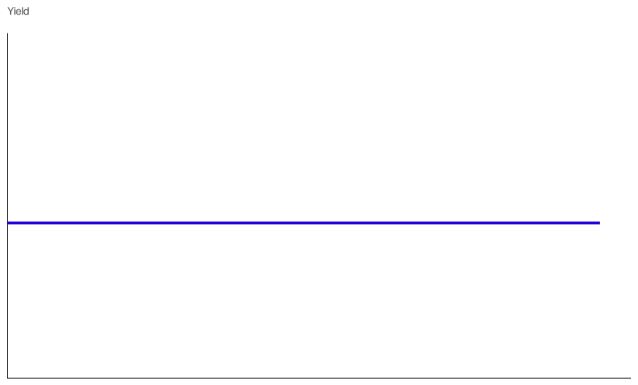
Figure 3: Downward-sloping maturity
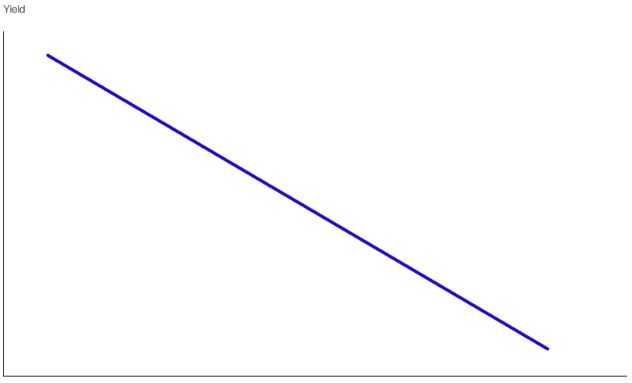
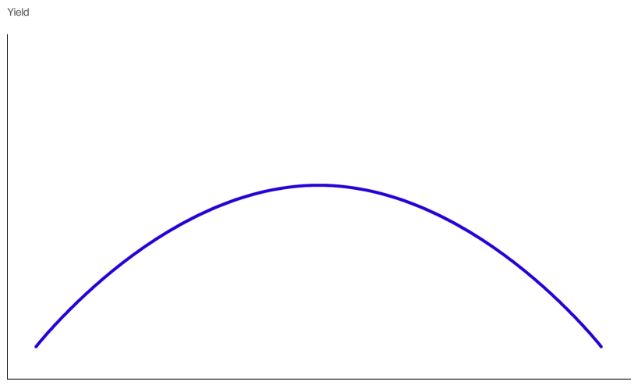
Figure 4: Humped maturity
More on shapes . . .
When yield curves slope upward, which they do most of the time, we say that they are normal sloping. The graph of a normal-shaped curve (Figure 1) shows us that long-term interest rates are higher than short-term ones. The flat yield curve (Figure 2) indicates that short- and long-term rates have the same yield. A downward-sloping or inverted yield curve (Figure 3) tells us that long-term rates are lower than short-term ones. Yield curves can have more complicated shapes in which they first slope up and then down, humped shaped (Figure 4), or down and then up.
But, why do the shapes change? Three theories
To account for the various shifting shapes, the following three theories offer up explanations for the relationship between interest rates, time, and investor preference.
Pure Expectation Theory states that the interest rate on a long-term bond will equal the average of the short-term interest rate investors expect to occur over the life of the long-term bond. The theory assumes then that bond investors are indifferent between, say, holding a two-year bond or buying a one-year and rolling it over at maturity.
Let’s take an example of an investor that could purchase a one-year bond and when it matures, buy another one-year bond. At the end of the two- year period, the investor would have the same return if she had purchased a two-year bond and held it to maturity. Because the Pure Expectation Theory states that both strategies have the same expected return, the interest rate on the two-year bond must equal the average of the two one-year interest rates. If the one-year was yielding 1.5 % and the investor expects the interest rate on the one- year bond next year to be 2%, she can calculate the expected return over the two- year holding period. It is the average of the two one-year rates. The rate of return on the two-year bond is the same as the return on holding the two one-year bonds. In our example, both are equal to 1.75%.
1.5% + 2%/ 2 = 1.75%
If short-term rates are low relative to their historical norm, investors are expecting that they will rise in the future so that the average of future expected short-term rates will be higher than the short-term rates today. This implies that the long-term rates will be higher than short-term rates, pricing in the expectations of future higher rates. This explains the shape of an upward-sloping yield curve (Figure 1). Investors also pay attention to the slope of the yield curve. A steeply upward-sloping yield curve is often interpreted as a signal for rising short-term rates while a mildly upward-sloping yield curve may mean investors expect short-term rates to stay about the same, the normal-appearing yield curve shape.
Conversely, if investors believed that today’s short-term rates were high relative to the norm, they would expect future short-term rates to go down rather than up. Long-term rates would fall below short-term rates, since the average of expected future short-term rates would be lower than the short-term rate today. The shape of the yield curve would then become inverted, with short-term rates higher than long-term rates (Figure 3). As we noted earlier, inverse yield curves forecast future recessions, signaling that short-term rates are expected to fall sharply. In fact, this signal has called the last seven out of seven recessions.
If the curve is flat (Figure 2), investors expect that short-term rates will essentially remain the same, not go up or down. A flat yield curve may predict that short-term rates may be expected to fall in the future, thereby resuming their more “normal” shape or invert, which tells another story altogether about where the economy may be heading.
Liquidity Preference Theory states that since investors prefer being more liquid than less liquid and since short-term debt is more liquid than long-term debt, shorter-term bonds are preferred over longer-term bonds. Investors will then require a return premium to compensate them for holding the less liquid, longer term-bonds. For any change in interest rates, the price of long-term bonds will be impacted more that the price of short-term bonds. So, holding longer-term bonds results in greater price risk and less liquidity and the liquidity premium demanded for longer maturities gives rise to an upwardly sloping yield curve. Because the risk of interest rate change increases with maturity, we expect to see an increasing yield premium as the term or maturity lengthens. Since the liquidity premium is always positive, this implies that the yield curve explained by the Liquidity Preference Theory will always be above the yield curve implied by the Pure Expectations Theory.
Market Segmentation Theory assumes that each investor has a favorite segment or maturity sector that they wish to invest in. The interest rates for each sector is determined by its demand relative to its supply. Unlike Pure Expectations Theory, investors are not indifferent between holding, say, a two-year bond or investing in a one-year and rolling it over. Bonds of different maturities are not substitutes for each other.
This can also explain the “humped” shape (Figure 4). In the humped curve, the yields in the center of the curve are higher than at either the short or long end. Its shape is determined by investor demand and not by expected future interest rates.
Typically, the demand for longer-term bonds is lower than the demand for shorter-term bonds. This results in prices falling and interest rates rising on the longer-dated bonds and prices rising and rates falling on the shorter-dated ones.
Closely related to an investor’s preference for a market segment is the Preferred Habitat Theory. Investors are thought to have a preferred habitat or specific bond maturity where they wish to invest. To move or invest outside their preferred habitat, the investor must earn a higher expected return. Like the Liquidity Preference Theory, investors' preferred habitat is with shorter-dated maturities. When investing away from their preferred habitat, investors will require a higher expected return. So here too, we would expect to see an upward-sloping yield curve.
Mini-Case: The Twist
Operation Twist was a program initiated by the US Federal Reserve (the Fed) in late 2011 and 2012 to help stimulate the economy in the aftermath of the Great Recession of 2007–2009. Since short-term rates were already near zero, the Fed hoped to lower long-term interest rates. They did this by selling short-term Treasuries and buying longer-term Treasuries. The effect on short-term rates was minimal, as the Fed still wanted to keep short-term interest rates low to prop up economic activity. Longer-term rates did fall, which reduced the borrowing costs of businesses and households. It was anticipated that this would then lead to more economic growth.
The Fed’s actions led to “twists” of either end of the yield curve. The long end dropped as the short end rose, forming a twisting action. Imagine holding a wet towel end-to-end and wringing out the moisture. A bit of trivia—the term “twist” was first used in 1961 in a reference to a Chubby Checker song that led to the dance phenomenon, "The Twist.”
About the author
Gayle Buff, CFP®, CFA, is the founder and president of Buff Capital Management (www.buffcapital.com), a Boston-based investment advisory firm. She is past chair of the CFA Society of Boston and of CFA Institute’s Private Wealth Advisory Committee. She is currently treasurer of the Boston Economic Club and lecturer at the Boston University Questrom School of Business.