
Risk Tolerance of Dynamic Rebalancing Strategies: Buy and Hold, Constant Mix, and CPPI
Buy and hold (B&H), constant mix, and constant proportion portfolio insurance (CPPI) are commonly used dynamic strategies for rebalancing portfolios. The B&H strategy allocates stocks into a particular percentage and bonds into the remaining percentage, and then “does nothing.” Due to this fixed allocation, the B&H strategy won’t fall below the initial value of the bond. The constant-mix strategy maintains a constant percentage of stocks in the portfolio by buying stocks when prices fall and selling stocks when prices rise. The CPPI strategy maintains the value of stock by the pre-determined multiple of cushion, which is the value of the portfolio minus the insured value of principle (i.e., floor). To protect the floor, the CPPI strategy requires buying stock when prices rise and selling stocks when prices fall (this algorithm is the exact opposite of the constant-mix strategy). Consequently, each strategy performs differently depending on the market situation. However, regardless of the market situation, each strategy reveals a consistent result for risk tolerance defined as the ratio of the value of stocks over the portfolio.
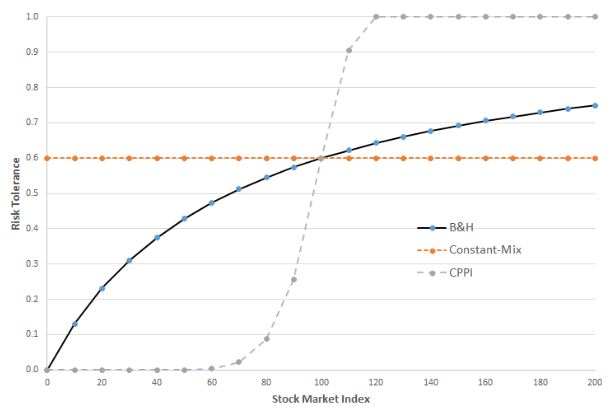
Suppose that an investor’s portfolio is initially worth USD 100 and that the stock market index is 100. For each strategy, the investor allocates 60% of the portfolio to a stock index fund and 40% into a bond. For simplicity, let’s assume away the transaction cost and the interest for the bond. In this initial setup, the CPPI will have a multiple of 6 and a floor of 90. The table and figure below demonstrate the value of the portfolio and its risk tolerance contingent to the stock index.
Based on the table and the figure, the risk tolerance of each strategy can be described as the stock market index increases as follows:
The B&H strategy increases its risk tolerance, but at a decelerating rate.
The constant-mix strategy maintains the same risk tolerance.
The CPPI strategy increases its risk tolerance more than proportionally to the percentage increase in the stock market index, but the risk tolerance is capped at 100%.
Before you choose the best rebalancing strategy for your final goals and stock market expectation, it would be smart to understand the risk tolerance of each strategy as illustrated by the simple simulation results of this short essay.
The Value of Three Rebalancing Strategies (amounts in USD)

The Risk Tolerance (Stock/Portfolio) of Three Rebalancing Strategies
About the Author
Young Cheol Jung, CFA, received his PhD in Economics at University of Ottawa. He has been teaching economics and finance at several universities in Canada for the past 12 years. Currently he is teaching Financial Economics, International Trade and Finance, and Macroeconomics at Mount Royal University in Calgary. His research interest is financial economics and international finance.